
“What’s the most important stat in golf?”
As a golf statistician, I’m asked this question more than almost any other. To answer it, I explain that there isn’t one – and if there were, I’d have no reason to be in business. We are all snowflakes. We have our own strengths and weaknesses and find our own special way to reach our number. That being said, the question is still an important one that deserves further study.
Research into my database of almost 900,000 golf rounds reveals that the game is an important balance of five different facets. In my 36 years of analyzing the game, I have yet to see a player that performed at the same handicap level across all five facets. We are all balancing the number of good shots/good results against the frequency and severity of our errors.
I refer to this as Golf’s SeeSaw Effect.

The secret to scoring at every level is much more than the ability to hit good shots. It’s also the skill to manage one’s game and limit the frequency and severity of bad shots or errors.
When I started my company 30-plus years ago, I discovered that one of the major deficiencies in golf statistics was that they did not address the negatives in the game. Even today, the PGA Tour produces more than 650 stats on each player and only one of them addresses a negative: 3-Putt Avoidance.
In fact, when I search the Tour’s ShotLink stats for “Penalty,” I get the surprising answer (in blue) below.
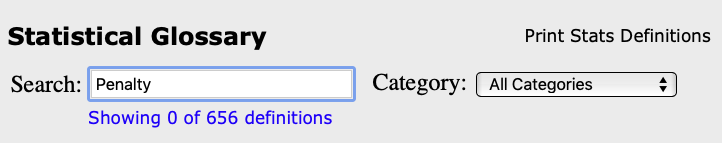
Could this be because penalties do not happen on Tour? Believe me, they do!
The significant role that errors play in our games led me to make sure that I captured them. As you can see by the graphic above, the seesaw effect is that the more good shots/results on the left match up with the fewer errors on the right, the lower one’s handicap will be.
Good Shots/Results Defined
- Greens Hit in Regulation (GIR’s).
- Chip/Pitch shots hit to within 5 feet of the hole (Chip/Pitch = shots from within 50 yards of the hole).
- Sand shots hit to within 8 feet of the hole (Sand = shots from sand within 50 yards of the hole).
- 1-Putts from 4–20 feet and greater.
Errors Defined
- Tee or Approach shots hit out of play (requiring an advancement, or resulting in a penalty).
- Chip/Pitch shots that miss the green AND require 4 or more strokes to hole out.
- Sand Shots that miss the green AND require 4 or more shots to hole out.
- 3-Putts from 30 feet and closer.
The seesaw graphic above is telling us the following about the zero handicap golfer:
Good Shots/Results = 21 (on average per round & rounded to whole numbers)
- GIR’s: 12
- Chip/Pitch shots to 5 feet: 4
- Sand shots to 8 feet: 1
- 1-Putts from 4-10 feet: 4
Errors = 1 (on average per round & rounded to 1 decimal)
- Tee & Appr. shots hit out of play or penalties: 0.9
- Chip/Pitch shots: 0.1
- Sand Shots: 0.1
- 3-Putts from 30 feet or closer: 0.3
[Note: How can a golfer make a Chip/Pitch error 0.1 times per round? Easy. The zero handicap golfer will make one of these errors on average every 10 rounds.]
Record these simple stats on a separate scorecard for the next 3-5 rounds to see where you fall on Golf’s SeeSaw. This exercise will reveal the true strengths and weaknesses of your game.

