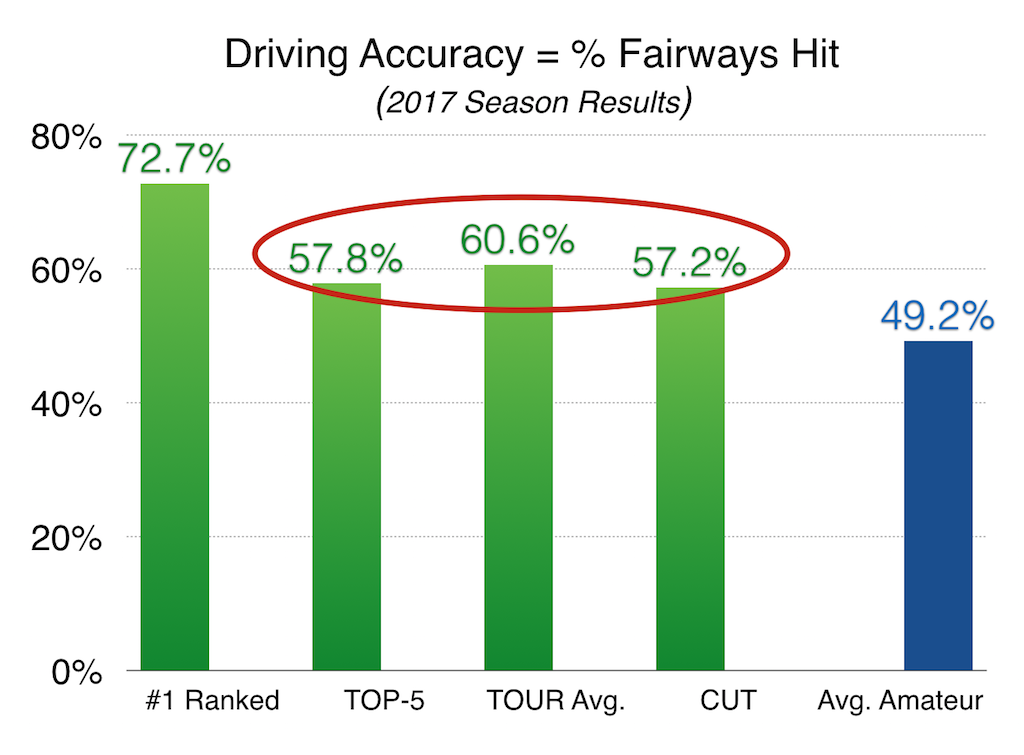
Hitting more than 50 percent of fairways has long been considered a good goal for amateur golfers. The winners on the PGA Tour tend to hit 70 percent. I have long maintained, however, that it is not the number of fairways HIT that matters. Instead, it is the relative severity of fairways MISSED.
Think about it. By the one-dimensional Fairways Hit stat, every miss is the same. A perfect lie in the first cut is exactly the same as a drive in a hazard… or even OB. There is nothing in the 650+ PGA Tour stats about this. In all, there are 60 stats in seven categories that relate to driving performance, but none about penalties! Like PGA Tour players don’t make any?
Let’s see exactly how important the old tried-and-true Driving Accuracy (Percentage of Fairways Hit) really is. To test it, I used two data clusters: the 2017 PGA Tour season (14,845 ShotLink rounds) and my ShotByShot.com database for the average male golfer (15 to 19 handicappers – 4,027 rounds).
For the graph below, I started with the No. 1-ranked player in the Driving Accuracy category: Ryan Armour. He certainly was accurate by this measure, but why did he only rank 100th in 2017 Strokes Gained Off the Tee with a barely positive 0.020?
Next I looked at the actual top-5 PGA Tour money winners (J. Thomas, J Spieth, D. Johnson, H. Matsuyama and J. Rohm), the 2017 PGA Tour average, and all PGA Tour players that missed the cut in 2017. We all know the significant scoring differences between these three categories of players, but it’s difficult to see a meaningful difference in the fairways hit. They’re not even separated by half a fairway. How important could this stat be?

For those that have not tried ShotByShot.com, our analysis includes Strokes Gained and Relative Handicap comparisons. That enables users to easily differentiate between FIVE MISS categories below based upon severity. The final three categories are what we consider to be Driving Errors:
- Good lie/Opportunity: One can easily accomplish their next goal of a GIR or advancement on a par-5.
- Poor Lie/Opportunity: One could accomplish the next goal, but it will require a very good shot.
- No Shot: Requires an advancement to return to normal play.
- Penalty-1: Penalty with a drop.
- OB/Lost: Stroke and distance penalty, or shot replayed with a stroke penalty.
As we are fortunate enough to work with several PGA Tour players at Shot by Shot, we have access to ShotLink data and can provide those clients with the same valuable insight.
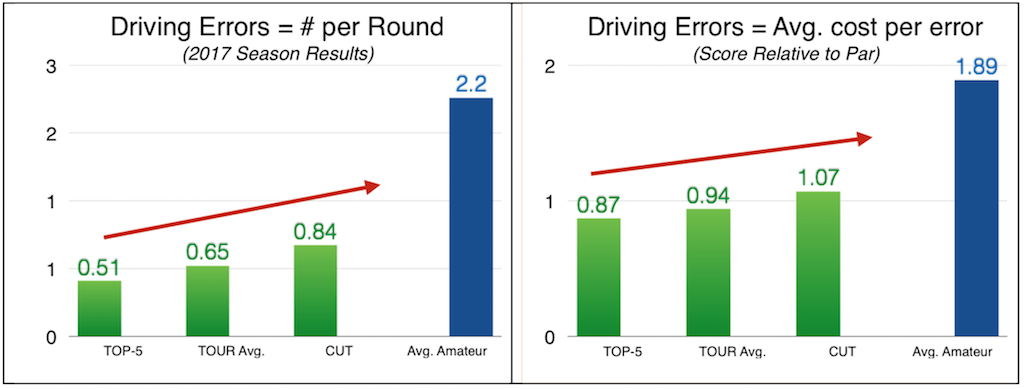
Let’s see how the frequency and severity of driving errors relates to the above groups of players (removing Mr. Armour, as he simply helped us prove the irrelevance of Driving Accuracy). The graphs below display the number of Driving Errors per round and the Average Cost Per Error. Note the strong and consistent correlation between the number and the cost of errors at each of the four levels of performance.

Finally, the average cost of the errors is heavily driven by the three degrees of severity outlined above (No Shot, Penalty, OB/Lost). The graph below compares the relative number and cost of the three types of errors for the average golfer and PGA Tour players. The major difference is that PGA Tour players do not seem to have a proper share of OB/Lost penalties. I found only TWO in the 14,000+ ShotLink rounds. While I accept that the most severe faux pas are significantly less frequent on the PGA Tour, I also believe there must have been more than two.

Why so few? First and foremost, PGA Tour players REALLY ARE good. Next, the galleries stop a lot of the wayward shots. Finally, I believe that many of the ShotLink volunteer data collectors may not actually know or care about the difference between a Penalty and OB/Lost.


