While working in the reinsurance business (General Reinsurance) in the early 1980s, a co-worker and I developed computer models to analyze prospective accounts. Our models helped predict the frequency and severity of losses and were used both to set pricing and to follow each account that was written.
During these years, I joined a golf club and decided to take the game seriously. I found traditional golf stats to be one-dimensional, yes/no answers to multi-dimensional questions, and useless. I had the idea that the approach that had worked so well in my business could also be applied to golf.
In 1989, my long-time friend and partner, Peter Heinke, started Golf Research Associates. We created a special scorecard that enabled users to record the position and distance of their approach shots and short game shots as well as the distance of their first putt.
Our early clients were Golf Digest and Pinehurst Golf Schools, so our data grew fairly quickly. By 1991, we had 7,000 rounds and were able to create a model of how the game was played from every position and distance.
We called it “Mr. Scratch” – a model of the average number of strokes to hole out from every position and distance on a golf course. It was made up of all of the rounds collected that were zero differential from the course rating. At the time, approximately 1,000 rounds.
In 1992, we released what we called my Strokes Lost/Saved analysis. Golfers subscribed to the annual service for $500. They received instructions and scorecards that they completed and mailed back.
With every 5 to 10 rounds returned, they would receive an analysis report. The first analysis was returned in a red, Shot By Shot notebook with dividers for each facet of the game. The first pages of the analysis explained the Lost/Saved analysis method in detail.
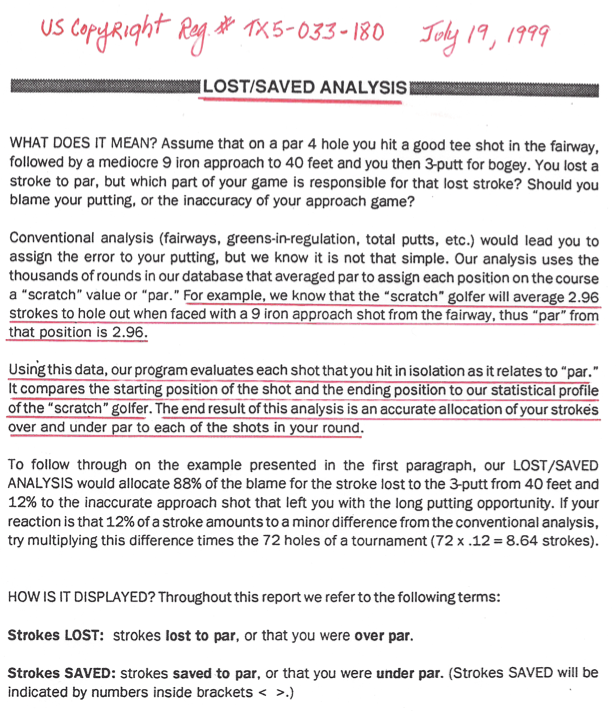
The analysis displayed the Strokes Lost or Saved (Strokes Gained) to par in comparison to each user’s target handicap.
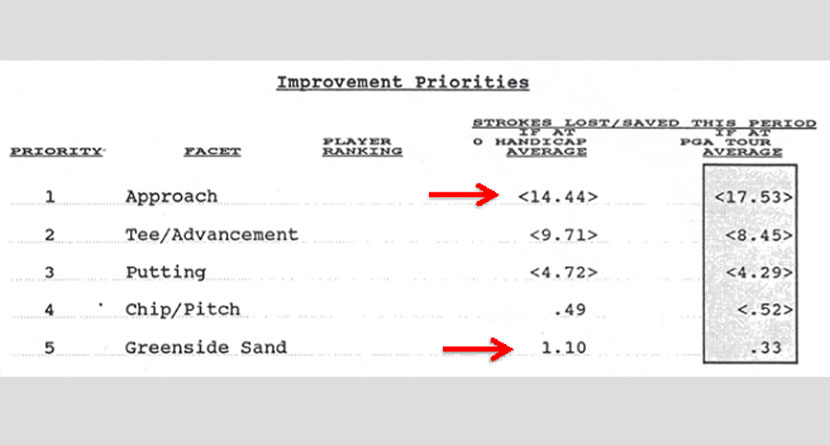
The graphic below is an example and reveals the Player’s #1 Improvement Priority to be his Approach Shots because it is the part of the game in which he lost the most strokes to par vs. his target (0 handicap) in the 5 rounds analyzed.
The player lost 14.44 strokes or 2.9/round in his Approach game alone. At the same time, the player was 1.10 shots better than the 0 handicap golfer in his Sand game.
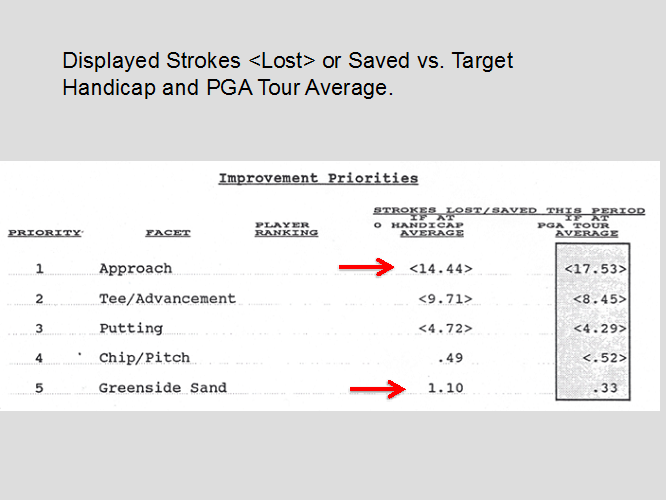
We also calculated the corresponding handicap level for each facet of the game. Notice, that the player’s Approach handicap level is that of a 9 handicap – reinforcing the need for improvement in that particular skill.
His Sand game handicap is that of a +3 golfer and slightly better than the average of the PGA Tour.
1994 – The World Scientific Golf Congress – L.M. Landsberger, a professor of Computer Engineering at Concordia Univ., Montreal, Canada – submitted a paper on what is now referred to as Strokes Gained Analysis.
Mr. Landsberger had used my program and phoned me with questions on a few occasions. Little did we realize that he was reverse engineering what we had done. At least he was good enough to credit me early on in his paper .
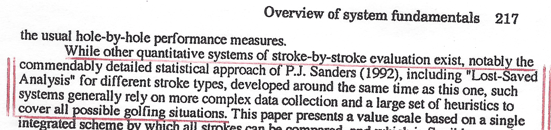
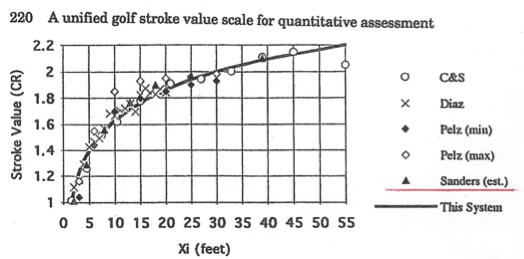
Mr. Landsberger went on to publish the data points that he was able to derive from his Shot By Shot analysis, but again, was good enough to footnote my contribution to his work.
Throughout these early years, I had a relationship with Golf Magazine and wrote and contributed to many articles featuring my unique approach to golf statistics and the unique perspective that it afforded.
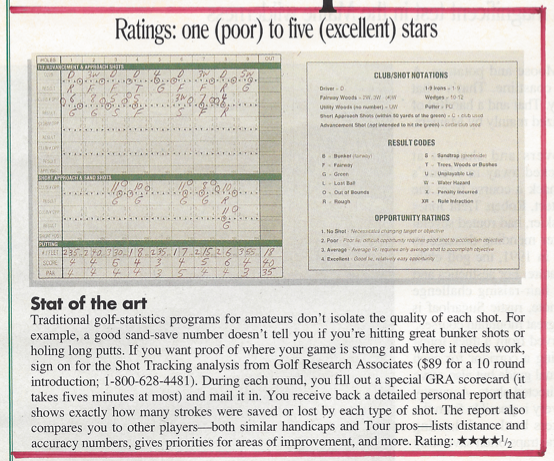
In 1995 Shot By Shot was featured in the August issue of Golf Magazine and rated 4.5 of 5 stars. Note, the image of my original scorecard along with the notation keys.
In 1998, I released a CD-ROM, a joint venture with Golf Magazine the product featured Shot By Shot Complete Game Analysis (Strokes Gained).
When an analysis was run, the user was directed to the Golf Magazine Private Lessons that would address the specific errors for the #1 Improvement Priority identified. This product was fairly successful and given its highest rating by PGA Tour Magazine.
In 2002, I put my Strokes Gained Putting Analysis on the web at ShotByShot.com, and by 2005, added the remainder of the game – Complete Game Analysis.
Over these years, I made three presentations to the PGA Tour on my Lost/Saved method of analyzing the game (1999, 2003 and 2005).
In 1999 there was no effective way to collect the data, but my more recent presentations were focused on the best possible use of the new ShotLink data that was to be collected. Suffice it to say, I must have made very poor presentations and as a small company — essentially a one-man band — got no traction from the powerful PGA Tour.
In 2011, the Tour launched its Strokes Gained Putting Analysis. Their media guide credited Mark Broadie in collaboration with a team from MIT.
In 2013, in his book Every Shot Counts, Mark Broadie details his history with the Strokes Gained innovation:
“So in 2001, I began work on a computer program called Golfmetrics to collect, store and analyze golf data. After a few years, the Golfmetrics database contained more than 100,000 shots from more than 200 golfers ranging in age from eight to 70-plus years, scores ranging from the 60s to the 140s.
“With such a sizable amount of data, I could start analyzing and studying golf performance, and trends started becoming apparent.
“I implemented the strokes gained approach for putts and off-green shots in the Golfmetrics system in 2005. In 2008, I published the first Strokes Gained results.”

