You might ask: How would I know the differences between a scratch golfer and a PGA Tour player? Well, it is my full-time job to know these type of things about golf. I have been studying the game from a statistical standpoint for 27 years.
I created the Strokes Gained analysis website, ShotByShot.com, before my time at SwingU as the Chief Data Officer and I work with PGA Tour members to extract clear answers from the Tour’s overwhelming 653 ShotLink stats.
My experience tells me that there is no such thing as an average game, no matter the handicap level. We’re all snowflakes and find our own unique way to shoot our number. With that said, our 800,000+ round database enables us to create a composite sketch of the average golfer at each level.
One of the beauties of our averages is that they are smooth across all five major facets so that every individual golfer’s strengths and weaknesses — and we all have them — stand out clearly by comparison.
The Data Used for this Study
- Mr. Scratch: I averaged the 8,360 rounds in our database that match the zero handicap criteria. In other words, the rounds when Mr. Scratch actually played to his 0 handicap.
- PGA Tour: The average of the 14,557 ShotLink rounds recorded in the 2015 season.
The Math
The USGA’s Course and Slope rating system does a sophisticated job of evaluating the relative difficulty of our golf courses. I joined my local course rating committee shortly after the new “Slope” system was added. My specific goal was to gain an understanding of how the system works so that I could effectively apply it in my analysis program.
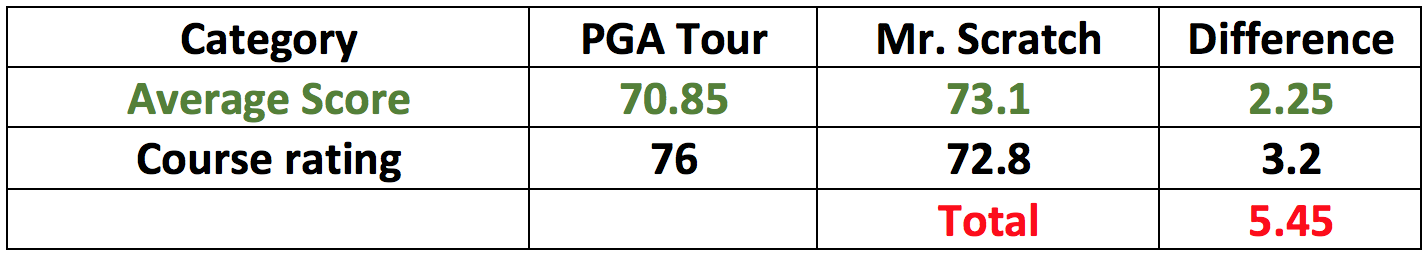
For the purposes of this article, the Course Rating reflects the relative course par for the scratch golfer. The chart below tells us that the PGA Tour scoring average is 2.25 strokes better than Mr. Scratch.
Further, Tour players are playing courses that are 3.2 strokes more difficult. The net result is a 5.45-shot difference between Tour players and Mr. Scratch, but let’s just call it 5.5.
Driving
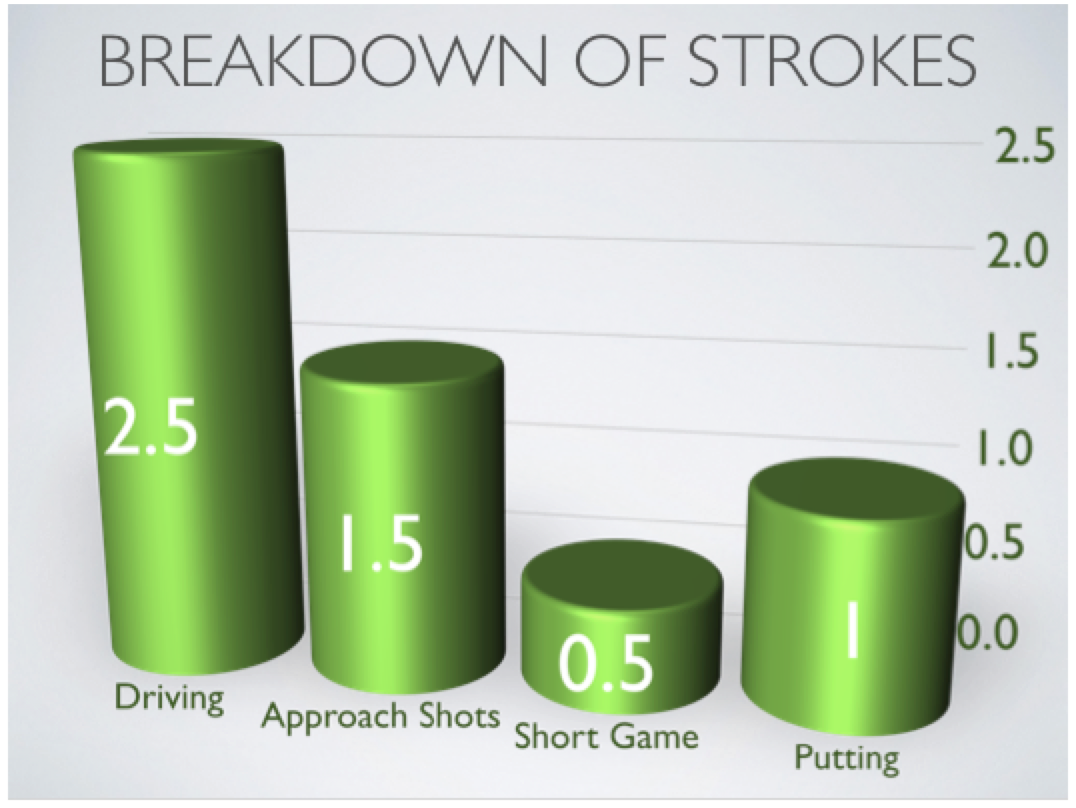
The chart above shows us that the biggest piece of the 5.5-shot pie falls into the Driving category, or Distance, which makes sense to me. To play the game for a living, one must be able to hit it straight and far. Even Zach Johnson, with whom I have had the great pleasure of working with for five years, is often considered a short hitter. I contend that he is simply more intelligent and recognizes the true value of accuracy. Zach is averaging 281 yards this year, only seven off of the Tour average. Short? Not by my standards.
The chart below indicates that the driving distance gap between the Tour and Mr. Scratch is 33 yards. The average approach shot distance on the PGA Tour is 175 yards. Adding the 33 yards to all 14 driving holes puts Mr. Scratch’s average approach distance at just over 205 yards. The Strokes Gained value of this added distance is 2.52 strokes (0.18 per attempt x 14 driving holes = 2.52).
Accuracy and Errors Per Round
Mr. Scratch appears slightly better than the Tour in accuracy and errors per round. With added distance inevitably comes some reduced accuracy and more errors. I believe this slight edge would more than disappear if Mr. Scratch were using the Tour’s big-boy tees.
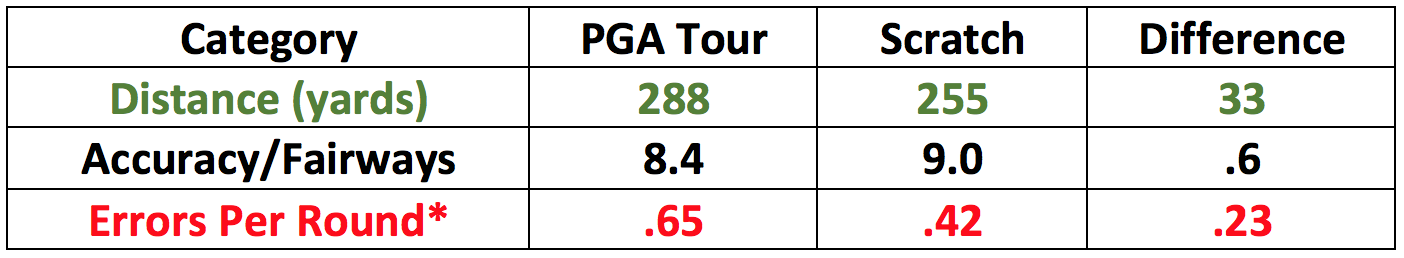
*Driving errors = Balls hit out of play, penalties, or shots requiring an advancement to return to normal play.
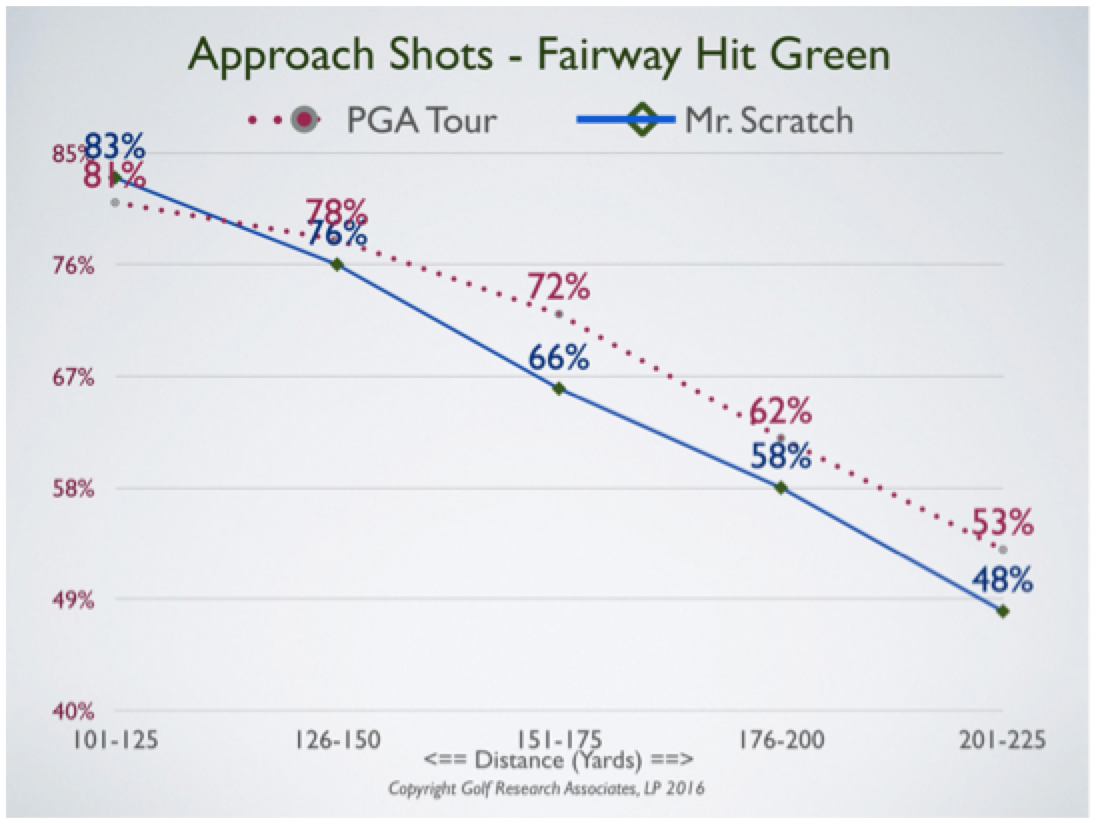
Approach Shots
As you can see by the chart below, Mr. Scratch is slightly less accurate from the distances that account for 80 percent of the Tour approach attempts. I estimate that Mr. Scratch’s reduced accuracy would account for at least two fewer GIR’s per round, at a cost of 1.5 strokes. It is interesting to note that Mr. Scratch incurs an approach penalty with the same frequency as the Tour average (1 in every 5 rounds).
Short Game
Mr. Scratch leaves his successful short game shots 1 foot farther from the hole. This difference in the range of 7-10 feet is worth 0.08 Strokes Gained. When multiplied by seven short game shots per round it’s 0.56 strokes, but we’ll call it half a stroke.
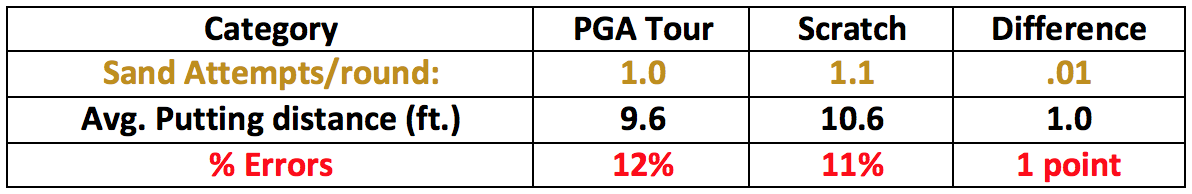
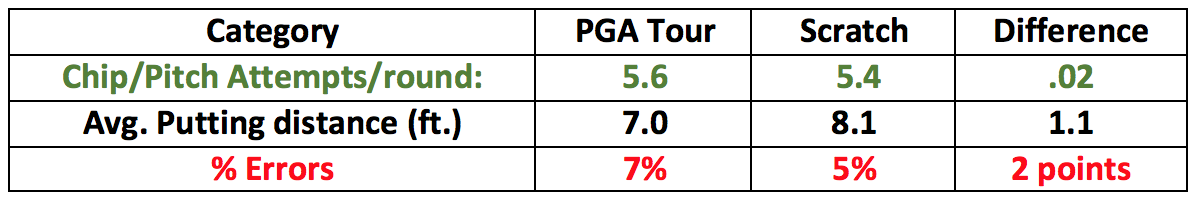
I am ignoring the minor difference in errors (shots that miss the green). My theory is that Mr. Scratch attains his excellent scoring level through meticulous short game consistency. The Tour players are so good that they try to get even the highest-risk shots close to the hole, confident that if they miss the green they will save the next — which they do 75 percent of the time. In 2015, only 25 percent of the short game shots that missed the green took more than three strokes to finally hole out.
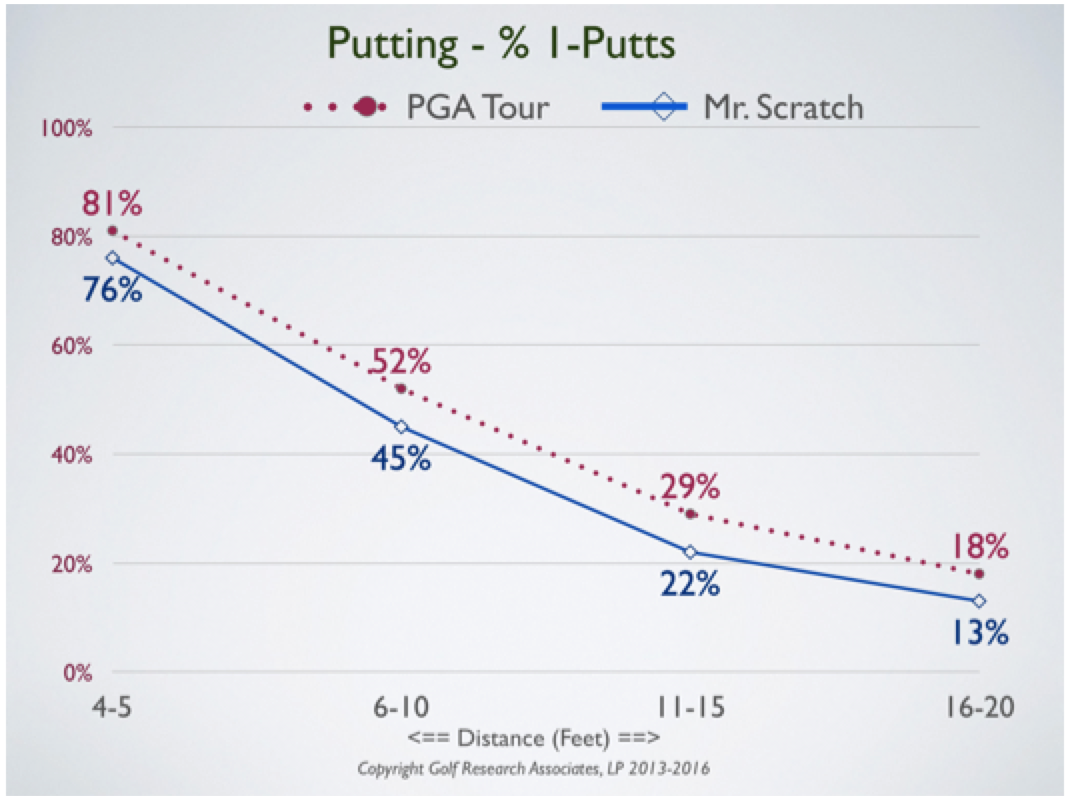
Putting
As you can see from the chart below, Mr. Scratch is slightly less proficient in the ranges that account for the vast majority of 1-Putt opportunities on Tour. Mr. Scratch also 3-Putts 38 percent more frequently than the Tour average. The Strokes Gained impact of these differences over 18 holes would be 0.9 strokes — let’s call it 1 stroke.
Conclusion
Bottom line, there is a measurable 5.5 stroke difference between Mr. Scratch and PGA Tour players. I have obviously not factored in the immeasurable effect of the added pressure and stress of teeing it up in a Tour event. Anyone who has participated in a PGA Tour Pro-Am will attest to the electric atmosphere and amplified pressure that comes with the experience.
If you want to try to get on the PGA Tour, your handicap needs to be a solid +3. If you want to support a family playing on tour, your handicap should be +5. Much easier said than done, however.

