By now, everyone understands Strokes Gained – or do they?
Briefly, every position (fairway, rough or sand) on a golf course has what I call a “Down-In” value based upon the distance from the hole. On the PGA Tour, these down-in or Strokes Gained values are based upon the number of strokes it takes for the average Tour player to hole out.
On ShotByShot.com, our Strokes Gained model is based upon the performance of the Scratch (zero handicap) golfer. The two performance models are not all that different. For example, the Tour’s 50% make distance, or 1.50 Strokes Gained for putting, is 8 feet. The ShotByShot value at 8 feet is 1.56 or 44% 1-Putt.
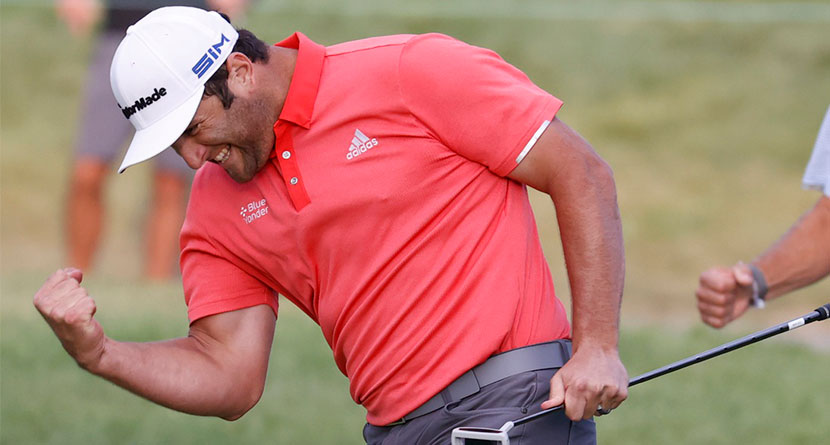
Why all this talk of Strokes Gained values? We all had to be impressed with Dustin Johnson’s dramatic, 43-foot downhill, side-winder on the 18th hole to force a playoff in the BMW. But then Jon Rahm burst DJ’s balloon with an even more difficult 66-foot birdie on the first hole of the playoff.
More than that, Rahm made FOUR birdies on the final back-9 to take a one-stroke lead. I thought it would be interesting to share the relative odds of Rahm making the FIVE birdie putts (the 5th in the playoff) that he needed to pull off a stunning win.
Please bear in mind that the percentages below reflect our ShotByShot Strokes Gained model. The Tour’s percentages would display slightly higher 1-Putt percentages, but you’ll get my point.
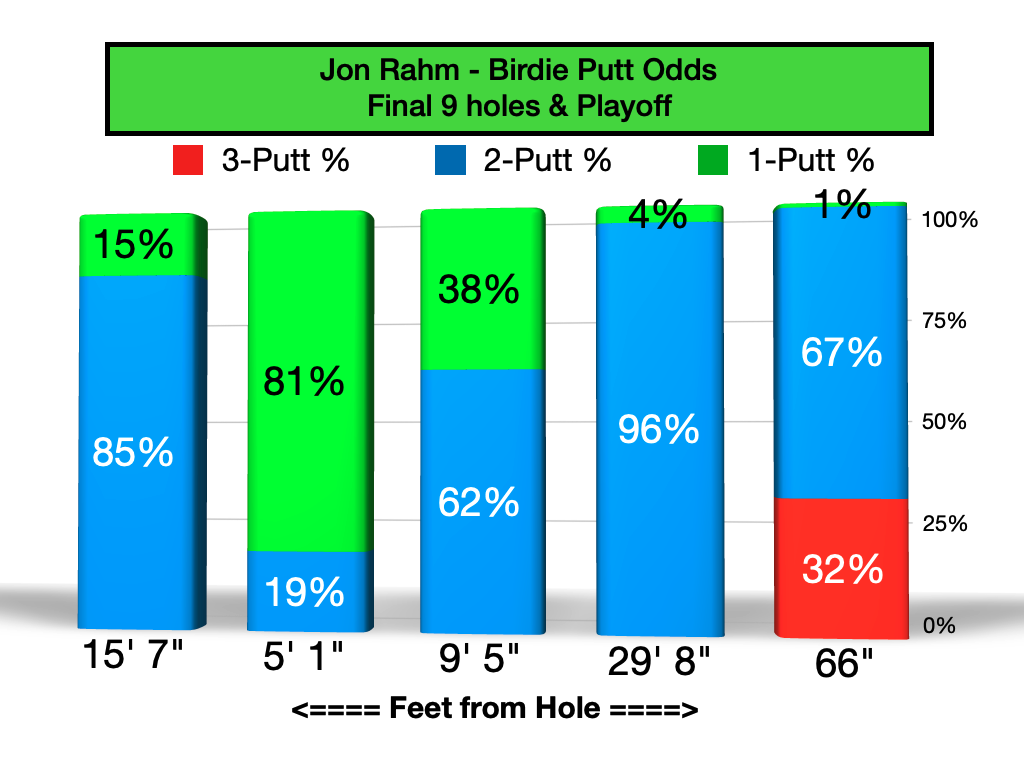
Even more impressive about his winning 66-foot putt is that Jon’s odds of making it were less than 1%, while the odds were more than 32 times as great that he would 3-putt.
Pile on the circumstances and the extreme difficulty of the speed and break, it borders on MIRACLE status.
I am sure that we will see it many, many times over the years and because of the situation possibly even more often than Tiger Woods’ “better than most” bomb on the 17th island green at TPC Sawgrass.
Peter Sanders is the President and a founding partner of ShotByShot.com, a unique strokes gained analysis program that helps golfers determine the precise strengths and weaknesses of each facet of their golf game.
Peter has worked with PGA Tour players and major champions such as Zach Johnson, Lucas Glover, Smylie Kaufman, Zack Sucher, Sepp Straka, Dylan Frittelli and Michael Thompson to analyze and interpret their data for game improvement.
Read more from Peter on his Niblicks of Truth blog at ShotByShot.com.

